


Dyadic International Inc. (DYAI:NASDAQ) is a U.S. biotechnology company specializing in protein expression and manufacturing solutions, leveraging its proprietary C1 and Dapibus fungus platforms.
Dyadic has secured strategic partnerships in the human and animal health, food technology, cell culture media, and industrial enzyme sectors.
A combination of new contract wins, platform scalability, and a broad market rotation into small-cap biotech stocks is creating the potential for positive cash flow and higher valuation.
As of July 2026, the company appears to have successfully transitioned from a pure R&D start-up to a commercial biomanufacturer.
Biotech: A Bullish Market Sector
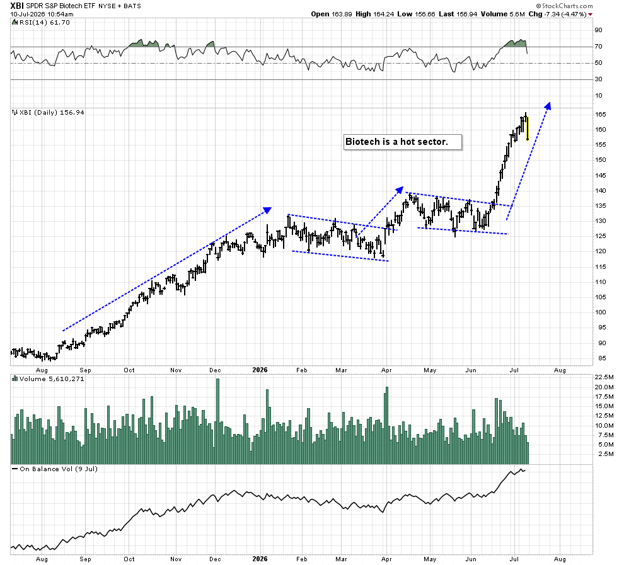
Technical analysis shows biotech to be one of the hottest market sectors, and the charts suggest it could stay hot for a long time. Pullbacks can be bought. In a nutshell, institutional and retail investors both want to invest in market leaders, and this sector is one of the strongest.
Figure 1: XBI:NYSE Biotech Sector ETF Chart
Technical Analysis and Observations:
- Biotechnology is in a major bull trend.
- OBV (On Balance Volume) is confirming the underlying strength of the trend.
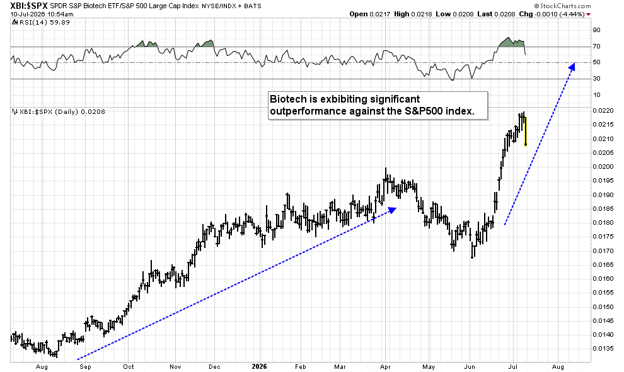
Figure 2: XBI Versus SP500 Index Comparison Chart
Technical Analysis & Observations:
- This chart clearly shows biotech is outperforming the S&P 500 index.
- Institutional investors are generally attracted to sectors exhibiting relative strength.
Commercial Momentum and Platform Validation
The U.S. government's significant shift away from foreign-dependent mRNA supply chains has created specific demand for non-mRNA, protein-based platforms like Dyadic's C1.
The primary fundamental driver for Dyadic's potential upside valuation re-rating is the successful commercial deployment of this C1 platform. Unlike traditional mammalian or bacterial systems, the C1 fungus offers rapid development, scale-up, higher yields, and lower production costs, which is a critical advantage in the current economic climate.
Strategic Expansion with Solid Partnerships
The company has moved beyond pilot programs into multi-year supply agreements. Recent announcements are validating the platform's ability to produce complex biologics at commercial scale.
For example, on March 2, 2026, Dyadic announced the planned 2026 commercialization of recombinant non-animal bovine chymosin enzyme with Denmark-based Inzymes. The company received a US$200,000 milestone payment for completing development, moving the project into a commercial phase that targets the multi-billion-dollar dairy enzyme market.
National Security
Dyadic's C1 platform is viewed as a strategic reserve technology.
It's stable, does not require ultra-cold chains, and can be produced entirely within the U.S.
Investor Risks
- Cash Burn: With approximately US$6.6 million in cash and a quarterly burn rate that appears to be near US$2 million, the company may have a clear “runway” only into Q2 2027.
- Customer Concentration: Revenue remains heavily dependent on a small number of strategic partners (e.g., Proliant Health & Biologics, Inzymes, Fermbox, and IBT Bioservices).
- Lack of Professional Advice: Before taking action with any investment, investors should consult with properly licensed, experienced, and qualified investment advisors and get numerous opinions. Failure to do so increases risk.
Note: The above is not a complete list of risks. Read Dyadic's 10K filing carefully for more information on investment risks.
 Streetwise Ownership Overview*
Dyadic International Inc. (DYAI:NASDAQ)
Ownership Breakdown
1There are about 40 institutional investors holding about 15% of the stock. Strategic entities hold another 25%.
The largest shareholder is the company's founder and CEO, Marc Emalfarb, with about 13% of the stock.
Shares Outstanding
- Approximately 36.44 million shares.
Analyst Buy Recommendation
US$5.00 Price Target
On May 14, 2026, Craig-Hallum analysts Matthew Hewitt and Tollef Kohrman said in their research report that they are reiterating their buy recommendation, with a US$5.00 price target for the stock.
They elaborate, “We continue to believe the company's commercialization efforts are bearing fruit as it moves from early-stage development toward initial revenue generation, supported by a growing base of partnerships, distribution agreements, and product launches.”
Undervalued Relative to Peers
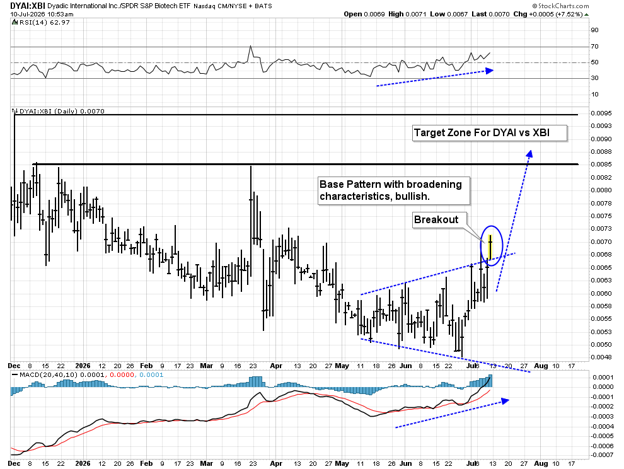
Figure 3: Dyadic Versus XBI Ratio Chart
Technical Analysis & Observations:
- A potential base pattern has formed for Dyadic against the powerful XBI biotech ETF.
- The stock looks ready to stage a significant rally against the XBI.
- MACD and RSI are exhibiting bullish leadership. In these types of technical situations, the price tends to follow the indicators and move higher.
- Dyadic has some well-known institutional shareholders, including Vanguard. If the company executes on its strategy, it could be picked up by a biotech ETF, and that would automatically bring investment from more institutional investors.
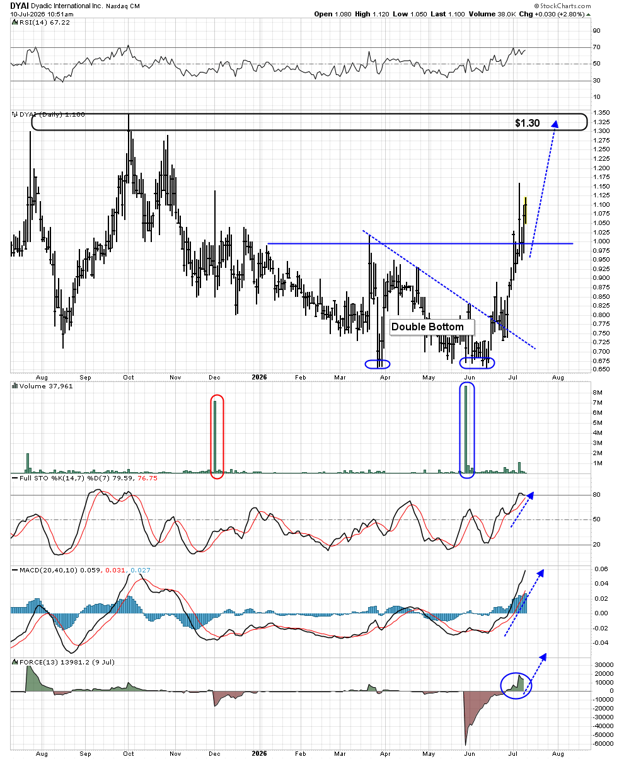
Figure 4: Dyadic Daily Chart
Technical Analysis and Observations:
- A double bottom pattern is in play, targeting the US$1.30 zone.
- A move to the target area would help secure the company's listing on the Nasdaq, where a lot of biotech stocks trade.
- Stochastics and MACD are in rising mode, and the FORCE money flow indicator just flashed a buy signal.
Figure 5: Dyadic Weekly Chart
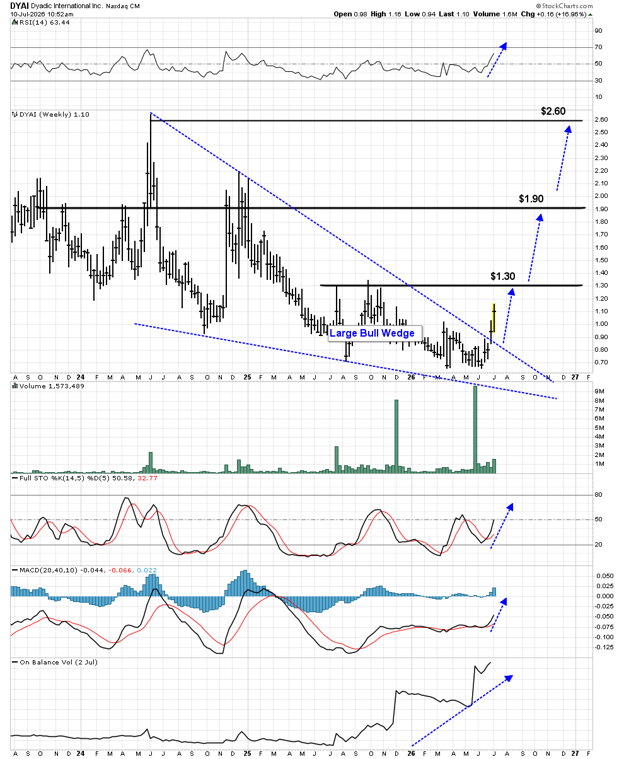
Technical Analysis and Observations:
- A significant bull wedge pattern has formed.
- A rally to the US$2.60 area highs appears likely.
- OBV (On Balance Volume) is rising aggressively.
- Stochastics is on a crossover buy signal, as is MACD.
Investment Thesis Summary
- Biotech is a bullish sector, strongly outperforming the SP500 index and getting a lot of institutional investor attention.
- Bullish chart action (including a large weekly chart bull wedge; see below) could be attributed to the company's successful deployment of its C1 platform.
- The platform could get a major boost from the US government's pivot towards non-mRNA, fungal-based platforms.
- With solid partnerships in place and fixed costs appearing to be largely established, new revenue streams should flow directly to the bottom line, which could lead to a substantial improvement in EBITDA margins in late 2026 and 2027.
Stock price at time of writing (July 13, 2026): US$1.00
Short-Term Price Target: US$1.30
Medium-Term Technical Price Target: US$1.90
Long-Term Technical Price Target: US$2.60
Technical Rating: Speculative Buy
| Want to be the first to know about interesting Biotechnology / Pharmaceuticals investment ideas? Sign up to receive the FREE Streetwise Reports' newsletter. | Subscribe |
Important Disclosures:
- For this article, Dyadic International Inc. has paid Street Smart, an affiliate of Streetwise Reports, US$4,000.
- Author Certification and Compensation: Stewart Thomson was retained and compensated as an independent contractor by Street Smart for writing this article. Mr. Thomson is a retired Canadian financial advisor who has passed the Canadian Securities Course as well as additional technical analysis courses that were mandated by his former employer and approved by Ontario regulatory bodies. For the past 15 years, he has been editing and writing numerous financial newsletters that have a strong focus on charts. The recommendations and opinions expressed in this content reflect the personal, independent, and objective views of the author regarding any and all of the companies discussed. No part of the compensation received by the author was, is, or will be directly or indirectly tied to the specific recommendations or views expressed.
- Statements and opinions expressed are the opinions of the author and not of Streetwise Reports, Street Smart, or their officers. The author is wholly responsible for the accuracy of the statements. Streetwise Reports requires contributing authors to disclose any shareholdings in, or economic relationships with, companies that they write about. Any disclosures from the author can be found below. Streetwise Reports relies upon the authors to accurately provide this information and Streetwise Reports has no means of verifying its accuracy.
- This article does not constitute investment advice and is not a solicitation for any investment. Streetwise Reports does not render general or specific investment advice and the information on Streetwise Reports should not be considered a recommendation to buy or sell any security. Each reader is encouraged to consult with his or her personal financial adviser and perform their own comprehensive investment research. By opening this page, each reader accepts and agrees to Streetwise Reports' terms of use and full legal disclaimer. Streetwise Reports does not endorse or recommend the business, products, services, or securities of any company.
For additional disclosures, please click here.
1. Ownership and Share Structure Information
The information listed above was updated on the date this article was published and was compiled from information from the company and various other data providers.